Basic Analysis - scRNA+scATAC
"Basic Analysis" is the initial module of the analysis pipeline, which performs gene and mitochondria filtering, batch effect removal, integration, and clustering to retain qualified cells for subsequent analysis. The pipeline creation and filtering/integration/clustering process are as follows:
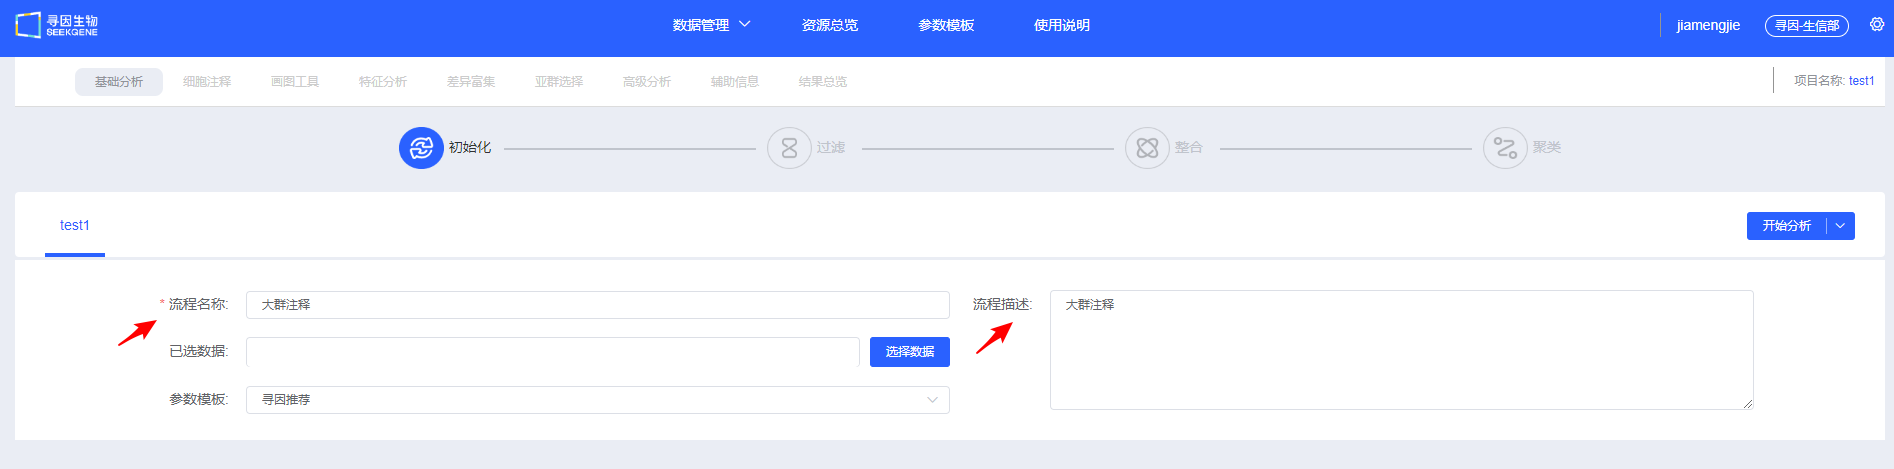
Initial Stage
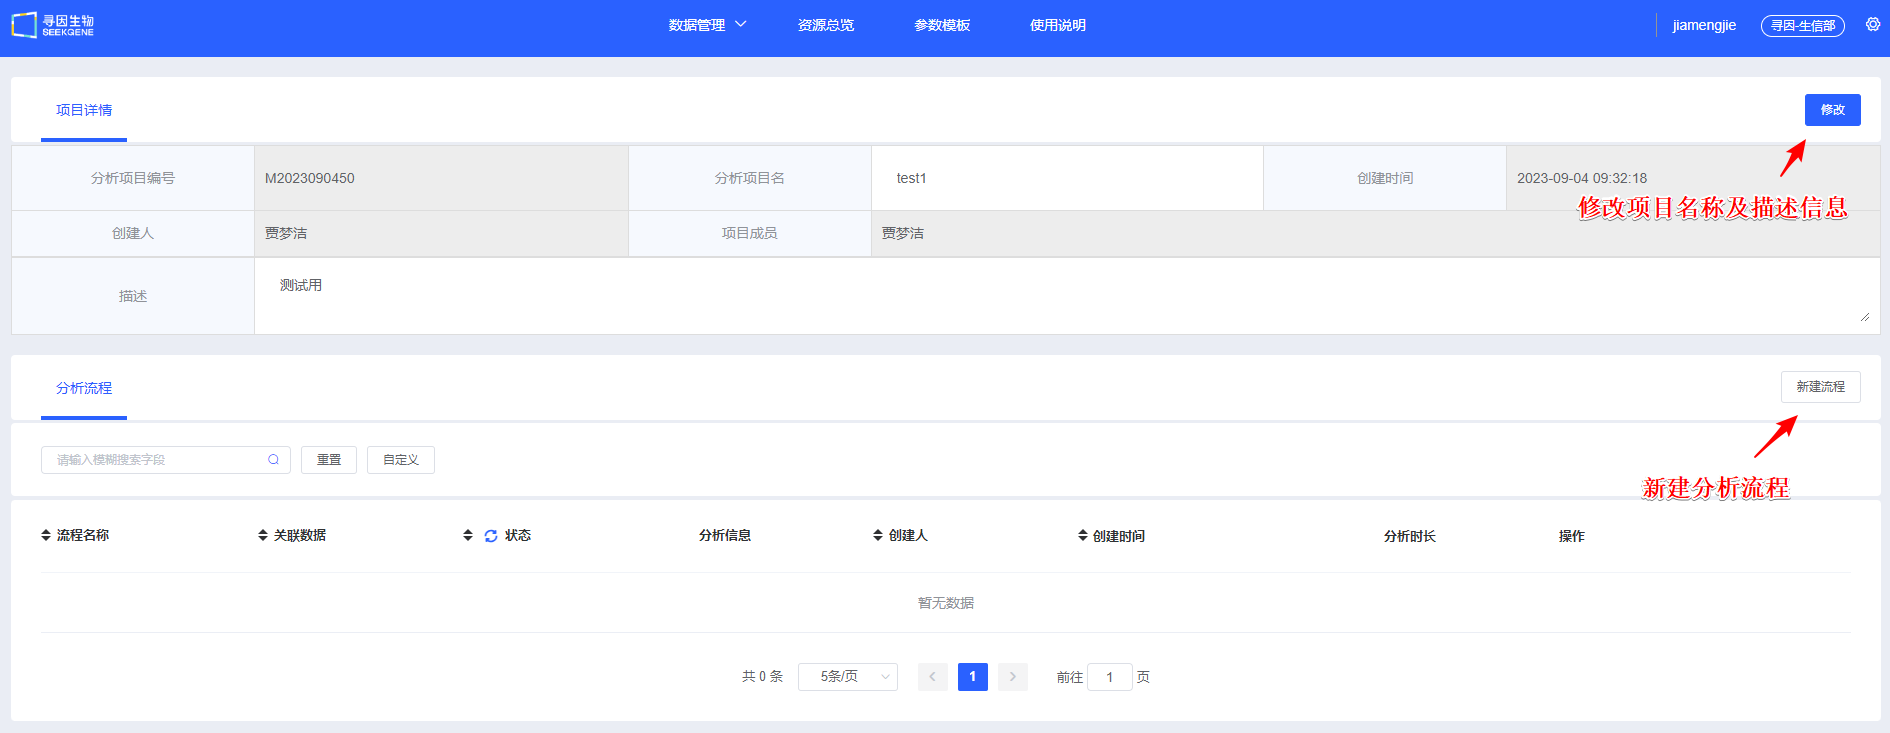
- [Create Process] Create a single-cell analysis workflow. Projects typically start by selecting samples for large group analysis, and later, annotated cell types can be selected for sub-cluster analysis.
- Enter a "Process Name" and "Description" to help you find and understand the workflow later.
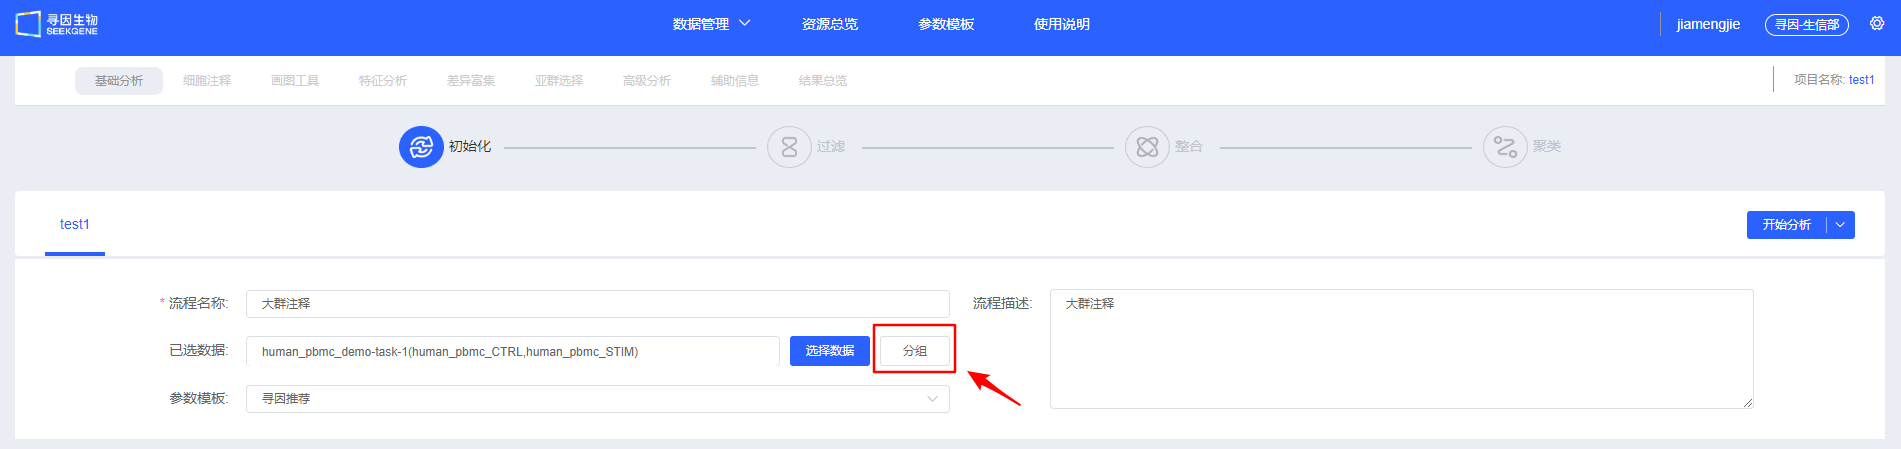
- [Select Data] Select the samples to be analyzed. You can choose multi-sample data that has already been integrated, or select multiple individual samples for filtering and integration. Whether it is integrated or single-sample data, you need to select the data type of ATAC standard analysis results.

NOTE
Detailed data sources can be found in Datas.
- [Group] Add grouping information to samples (optional). You can also add grouping information in later modules; refer to Visualisation for the label feature and Differential Enrichment for grouping functionality.
- After filling in the information and selecting the data to be analyzed, select the pipeline type as scRNA+scATAC. You can choose [Start Analysis] to manually perform filtering, integration, and clustering, or click the drop-down box to select [Basic Analysis], [Basic Analysis + Cell Annotation], [Basic Analysis + Cell Annotation + Differential Enrichment], or [Basic Analysis + Cell Annotation + Differential Enrichment + Visualisation] for quick automatic analysis.

Filter
- After you click [Start Analysis], the "Charts & Data" section summarizes UMI counts, mitochondrial proportions, and gene expression to provide an overview of sample quality. It also displays ATAC data indicators such as nucleosome signal, TSS enrichment score, and peaks in cells.

- Expand the panel to view default parameters. You can reference filtering settings reported in published single-cell studies when running [Filtering].
TIP
If you selected pre-integrated data, clicking [Filtering] prompts you to decide whether to skip the filtering and integration steps. Skip them when no parameter adjustments are needed; cancel the skip to rerun filtering and integration when thresholds must be tuned.

- After [Filtering], review the post-filtering quality metrics for each sample. You can fine-tune individual samples to maintain consistent overall quality.

CAUTION
Avoid mechanically "raising cell counts" (for example, loosening lower bounds purely by intuition). If the waterfall plot lacks a clear inflection point, background is high, or low-UMI populations are abnormal, forcing recovery reduces downstream stability.
For detailed knowledge explanations related to quality control of scRNA-seq+scATAC-seq dual-omics data, please refer to Quality Control of Single-Cell ATAC-RNA Multi-omics Data.
Integration
- Once QC passes, click [Integration]. Four integration methods are available; CCA, Harmony, and RPCA perform batch correction across multiple samples. During integration, scRNA-seq data between samples are integrated with scRNA-seq data, and scATAC-seq data are integrated with scATAC-seq data. After selecting the integration method for RNA data, the integration method for ATAC data will automatically self-match according to the RNA integration method.

TIP
The default value for the ATAC min.cutoff parameter is 5. It is recommended to use the default value for this parameter.

- After [Integration], you can view the integration status of RNA data and ATAC data respectively, and adjust integration parameters to re-integrate. It is recommended that users try multiple integration methods and choose the one that best suits subsequent analyses.

TIP
Choosing an integration method:
- Weak batch effect: merge directly to avoid overcorrection.
- Moderate batch effect: Harmony. Usually, batches between data produced on the same platform can be effectively corrected with Harmony. CCA/RPCA may overcorrect.
- Pronounced or heterogeneous batches: CCA/RPCA are more robust.
TIP
Three criteria for evaluating integration quality:
- Batch mixing: The same cell type mixes evenly across samples on UMAP/TSNE (
Check RNA Integration Effect) and ATAC UMAP/ATAC TSNE (Check ATAC Integration Effect). - Biological signal retention: Classic marker gradients and cluster boundaries remain clear, and differential/enrichment results meet expectations.
- Over/under-correction warnings: Overcorrection flattens differences, while under-correction produces clusters grouped by batch.
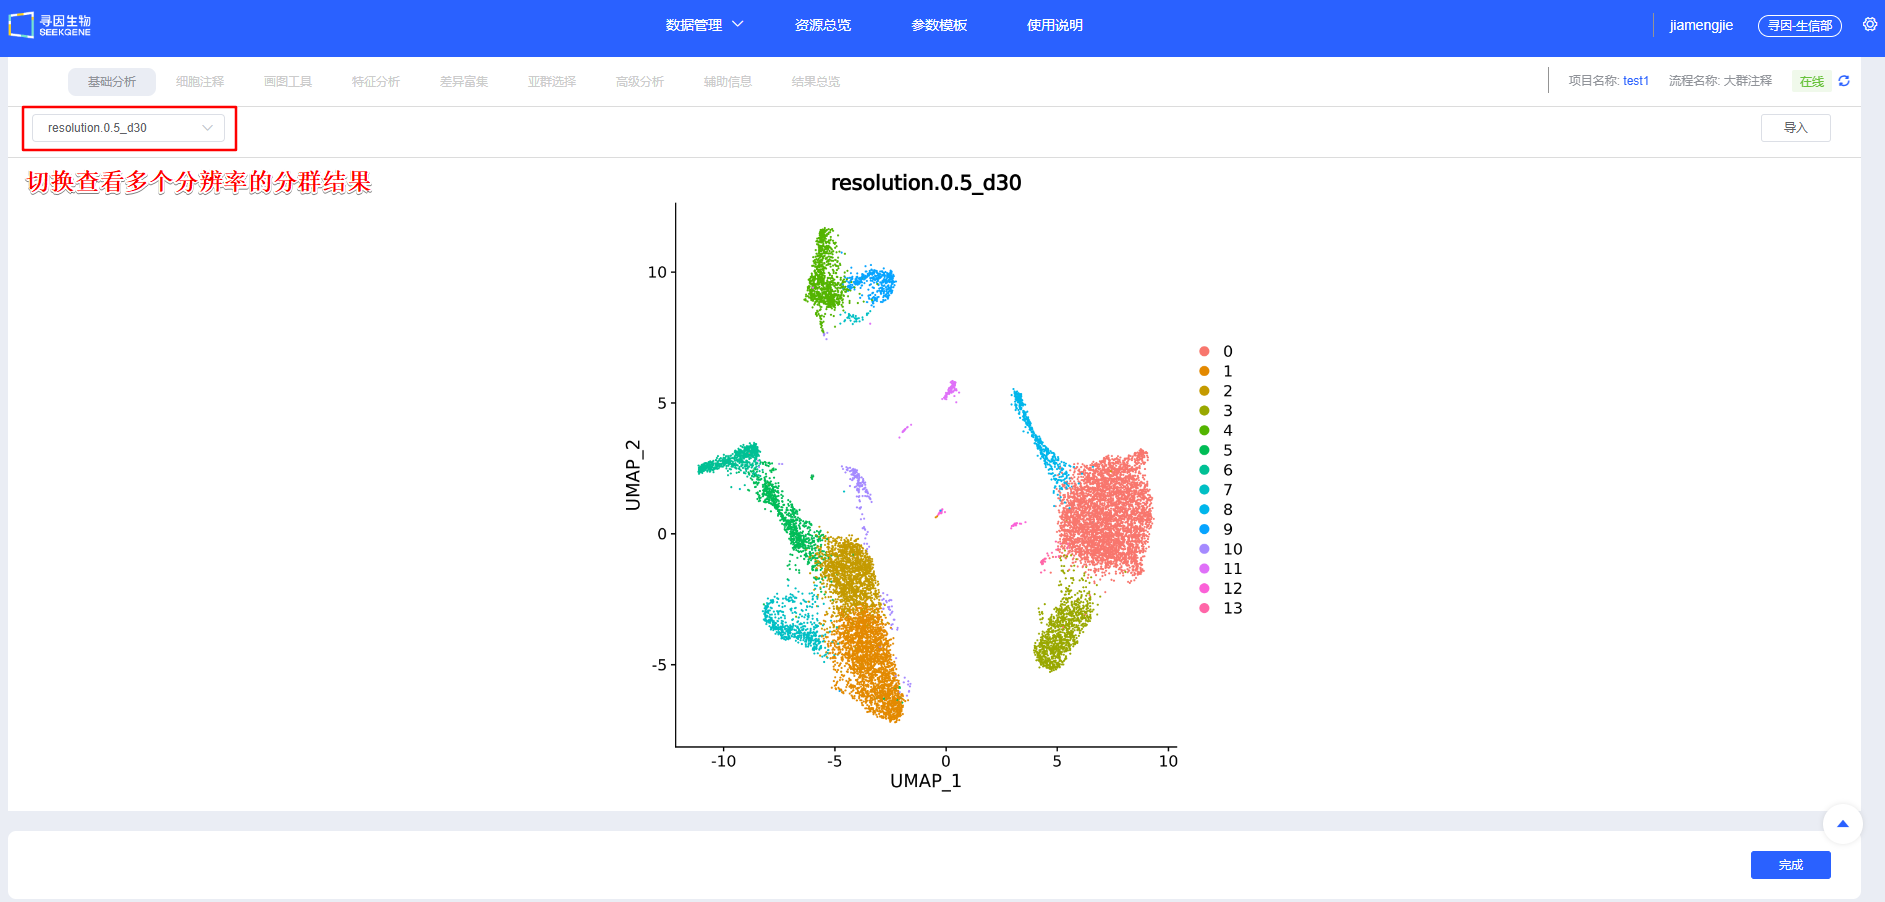
Clustering
After confirming [Integration], proceed with [Clustering]. You can create clustering results at multiple resolutions. scRNA-seq and scATAC-seq dual-omics data will undergo three types of clustering: clustering based on ATAC data, clustering based on RNA data, and wnn clustering combining RNA and ATAC data. Additional resolutions can be added in later modules.

TIP
Clustering tuning and troubleshooting:
- Elbow method for RNA data: Use the PCA elbow point as the starting value for dims; increase it as the cell count grows.
- The first dim of lsi for ATAC data is usually technical noise and needs to be selected starting from the 2nd lsi. If dims are too low, key heterogeneity may be missed; if too high, overclustering and amplified noise can occur. Optimize based on elbow points and reproducibility.
For detailed knowledge explanations related to dimensionality reduction and clustering of scRNA-seq+scATAC-seq dual-omics data, please refer to Dimensionality Reduction and Clustering of Single-Cell ATAC-RNA Multi-omics Data.
Complete
After [Clustering], if no adjustments are needed, click [Complete] to jump to the Cell Annotation module and begin downstream single-cell analyses. This step takes some time—please be patient.